Note
Go to the end to download the full example code.
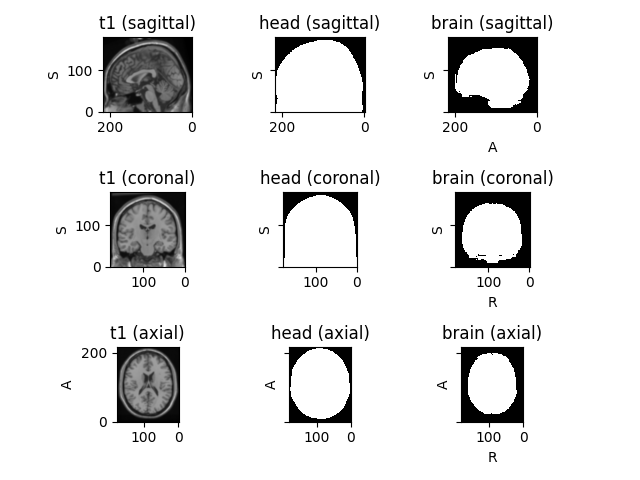
Plot a subject
Use torchio.Subject.plot() to plot the images within a subject.
import torchio as tio

tio.datasets.Colin27().plot()
Total running time of the script: (0 minutes 3.678 seconds)
Note
Go to the end to download the full example code.
Use torchio.Subject.plot() to plot the images within a subject.
import torchio as tio
tio.datasets.Colin27().plot()
Total running time of the script: (0 minutes 3.678 seconds)